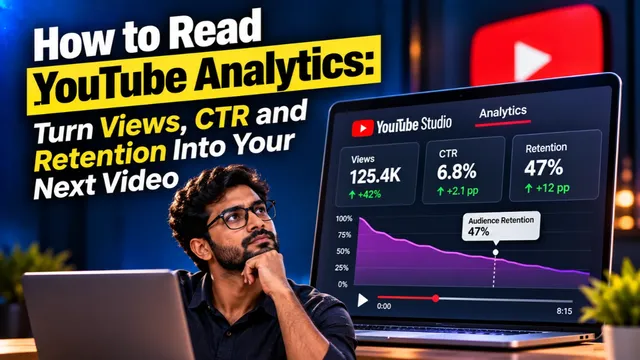

Join Data Analytics with Machine Learning & AI Course in Amritsarand Master Real-World Data Skills!
Our Data Analytics with Machine Learning & AI course takes you from raw data to real decisions — covering Python, statistics, SQL, data visualization, machine learning, and applied AI. No prior coding background required.... By the end of this course, you'll be equipped to take on roles like Data Analyst, Junior Data Scientist, or ML-focused roles across industries where every business decision now runs on data.

5672
Students Trained
8+
Years of Experience
4.9★
Google Rating
50+
Workshops Conducted
What Does the Data Analytics with ML & AI Course Cover?
This course covers Python, statistics, SQL, data visualization, machine learning, and applied AI — built around 8 hands-on modules and a real capstone project, taking you from raw data to a working, deployable model.
What Are the Core Modules in This Course?
The course runs in two stages — foundational data skills first (Python, statistics, data wrangling, SQL, and visualization), followed by machine learning and AI (supervised and unsupervised learning, deep learning basics, and a capstone project).

Python for Data Analytics
Core Python fundamentals with a focus on the libraries used for data work: varia... Core Python fundamentals with a focus on the libraries used for data work: variables, control flow, functions, and an introduction to NumPy and Pandas.
Statistics & Probability Fundamentals
Descriptive statistics, probability, distributions, and hypothesis testing, expl... Descriptive statistics, probability, distributions, and hypothesis testing, explained through practical examples.
Data Wrangling & Analysis with Pandas
Clean, transform, and analyze real datasets: missing data, merging, grouping, an... Clean, transform, and analyze real datasets: missing data, merging, grouping, and aggregation.
SQL for Data Analytics
Query and extract insights from databases — the skill most data analyst job post... Query and extract insights from databases — the skill most data analyst job postings list as a requirement.
Data Visualization & Dashboards
Turn analysis into a story using Matplotlib, Seaborn, and Power BI, so stakehold... Turn analysis into a story using Matplotlib, Seaborn, and Power BI, so stakeholders can actually understand your findings.
Machine Learning Fundamentals
Supervised and unsupervised learning: regression, classification, and clustering... Supervised and unsupervised learning: regression, classification, and clustering with Scikit-learn.
Introduction to AI & Deep Learning
Neural network basics and a practical introduction to how modern AI tools, inclu... Neural network basics and a practical introduction to how modern AI tools, including generative AI, work under the hood.
Capstone Project
An end-to-end project: raw data through cleaning, analysis, visualization, and a... An end-to-end project: raw data through cleaning, analysis, visualization, and a working ML model — the project you'll show in interviews.
What Tools and Technologies Will I Master?
You'll work hands-on with Python, SQL, Pandas, NumPy, Matplotlib, Seaborn, Power BI, and Scikit-learn — the exact stack most data analyst and junior ML job postings ask for.
Python, SQL, Pandas & NumPy
-
Work hands-on with the exact stack most data analyst and junior ML job postings ask for.
Matplotlib, Seaborn & Power BI
-
Turn analysis into dashboards and stories stakeholders can actually understand.
Scikit-learn & Model Evaluation
-
Judge whether a model is actually good — evaluation, tuning, and practical ML fundamentals.
Real-world, Messy Datasets
-
Practice on real datasets, not clean textbook examples.
Business Problem-Solving
-
Turn a business question into a data question, and a data question into a decision.
Industry-Standard Tools
-
Excel, SQL, Power BI, Python, and Scikit-learn — the tools used on the job.
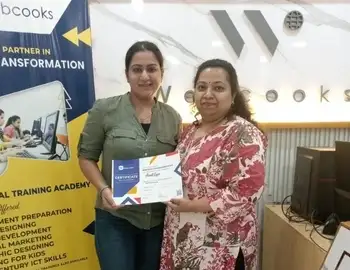
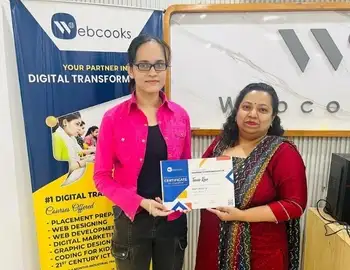
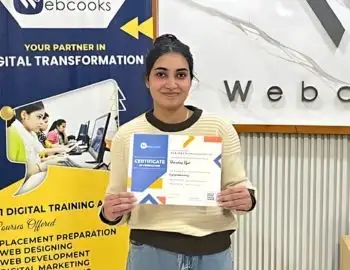
Master Data Analytics, ML & AI with Certified Industry Experts































































Who Should Join This Course, and What Will I Build?
This course is built for complete beginners, students, job seekers, and working professionals who want practical data skills, with no prior coding experience required, and includes real projects like dashboards, forecasting models, and a recommendation system.
What Real Projects Will I Build?
You'll build a sales dashboard, a customer segmentation model, a sentiment analysis tool, a sales forecasting model, an exploratory data analysis project, and a product recommendation system.
Build a dashboard that turns sales and performance data into decisions stakeholders can act on.
Group customers with unsupervised learning so marketing and product teams can target the right segments.
Classify review text to surface what customers actually think about a product or service.
Forecast future sales from historical data so planning is driven by evidence, not guesswork.
Explore a messy real-world dataset, find the story in the numbers, and present clear findings.
Recommend products based on behaviour and similarity — a portfolio piece interviewers recognise.
Who Is This Course For?
Beginners, students and graduates, job seekers targeting analyst or entry-level data science roles, IT professionals pivoting careers, and business owners who want to understand their own data.
ISO Certified Digital Academy

What Can You Learn in the Power BI, Tableau & Advanced Excel Crash Course in Amritsar? (15/20/30 Days)
If you want one specific data tool fast, our Power BI, Tableau, and Advanced Excel crash courses in Amritsar run 15/20/30 days each, a quicker route than the full Data Analytics with ML & AI course.
What Will You Learn in the Power BI Crash Course?
15 Days
Importing and cleaning data with Power Query, core visuals, and your first dashboard.
20 Days
Everything in 15 days, plus data modelling, relationships, and DAX measures, with interactive dashboards.
30 Days
Everything above, plus advanced DAX, publishing and sharing reports, and a complete business dashboard project.
What Will You Learn in the Tableau Crash Course?
15 Days
Connecting data, dimensions and measures, core charts, and basic dashboards.
20 Days
Everything in 15 days, plus calculated fields, filters, parameters, and maps.
30 Days
Everything above, plus advanced calculations (including LOD expressions), data storytelling, and a full dashboard project.
What Will You Learn in the Advanced Excel Crash Course?
15 Days
Formulas, lookups (VLOOKUP/XLOOKUP), pivot tables, and charts.
20 Days
Everything in 15 days, plus data cleaning, conditional formatting, data validation, and dashboards.
30 Days
Everything above, plus Power Query, macro basics, and a complete reporting project.
Best for:Analysts, accountants, business owners, and students who need a specific data tool quickly. Want the full picture? The Data Analytics with ML & AI course covers Python, SQL, machine learning, and AI as well.