
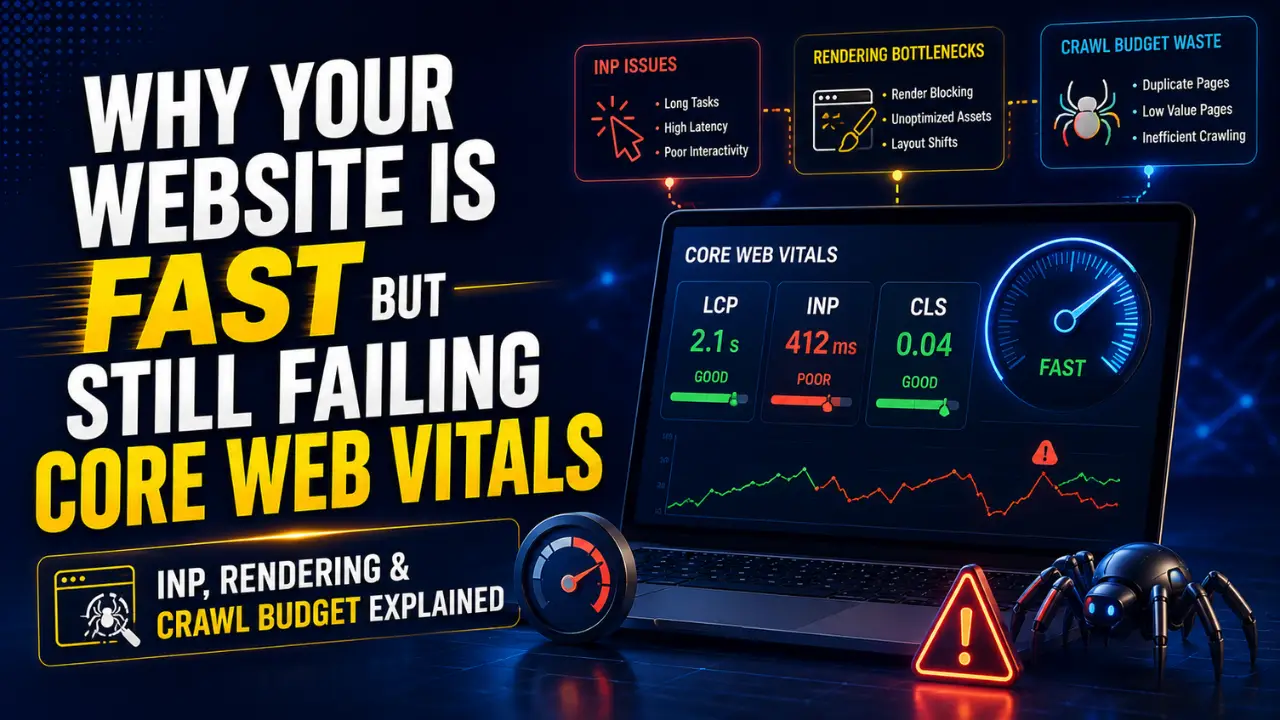
Why Your Website Is Fast but Still Failing Core Web Vitals — INP, Rendering & Crawl Budget Explained
"My website loads fast."
It's one of the most common sentences in technical SEO.
The developer opens the homepage on office Wi-Fi.
Two seconds later:
"See? Fast."
Meanwhile, Search Console reports Core Web Vitals failures.
Customers complain that filters freeze.
Mobile conversions lag behind desktop.
Googlebot spends time crawling thousands of parameter URLs.
So—is the website actually fast?
Performance in 2026 isn't one number.
You need to understand real-user experience, interaction responsiveness, JavaScript rendering and crawler efficiency.
1. Why Your Core Web Vitals Don't Match Your PageSpeed Score
Google's Core Web Vitals currently measure three major aspects of user experience.
LCP — Largest Contentful Paint
How quickly does important primary content appear?
A good experience is generally 2.5 seconds or less.
INP — Interaction to Next Paint
How responsive is the page when users interact?
Google's good threshold is 200 milliseconds or less.
CLS — Cumulative Layout Shift
How visually stable is the experience?
A good score is 0.1 or less.
Here's where confusion begins.
Your Lighthouse test and Search Console can report different stories.
That's because they aren't necessarily measuring the same thing.
Lab vs real users
Lab tools test controlled conditions.
CrUX uses aggregated field experience from eligible Chrome users.
Your developer might have:
MacBook Pro,
fibre internet,
cached assets,
nearby CDN node.
Your customer may have:
budget Android phone,
mobile data,
slower CPU,
unstable connection,
consent banner,
analytics,
chat widget.
Which experience matters?
Both help diagnose performance—but field data tells you what eligible users actually experienced.
Real brand case study: Vodafone
In a performance case study published through Google's web.dev, Vodafone reported an A/B test where a 31% improvement in LCP was associated with an 8% increase in sales.
It also reported improvements in other engagement metrics.
Don't turn that into:
"Improve LCP 31% and your revenue increases 8%."
Your website isn't Vodafone.
The valuable lesson is that performance improvements can be measured against business behaviour, not merely SEO tools.
Ask your team
Next time someone says:
"The site is fast,"
ask:
For which users?
Then segment performance by:
mobile vs desktop,
page type,
geography,
connection,
new vs returning users.
Suddenly "fast" becomes measurable.
2. Why INP Fails Even When Your Website Loads Quickly
Consider this ecommerce experience.
Page loads:
1.7 seconds.
User taps:
Add to Cart.
Response:
850 milliseconds.
Would the shopper describe that as fast?
Probably not.
That's the problem INP helps expose.
Loading speed tells only part of the story.
Users interact with:
menus,
filters,
search,
forms,
accordions,
checkout buttons,
sliders,
Add to Cart.
Those interactions compete for browser resources.
What blocks interaction?
JavaScript runs on the browser's main thread.
If that thread is busy executing a long task, the user's interaction may have to wait.
Common offenders include:
oversized JavaScript bundles,
expensive event handlers,
third-party analytics,
advertising,
chat widgets,
personalization,
DOM manipulation,
framework hydration.
Example
Your mobile menu click triggers:
analytics event,
React state update,
animation,
personalization check,
DOM recalculation,
tracking event.
The customer wanted one thing:
Open the menu.
Your application decided to do six.
That's how performance debt accumulates.
Start with the interaction that makes money
Don't optimize INP abstractly.
For ecommerce:
Add to Cart
For lead generation:
Submit Form
For travel:
Search Availability
For SaaS:
Start Trial
Measure the interaction most closely tied to your conversion.
Then investigate what runs between input and the next visual update.
Audience question
How many third-party scripts are currently installed on your website?
Now:
How many does someone on your team still actively need?
That second number is often much smaller.
3. How JavaScript Rendering and Crawl Waste Create SEO Problems
React, Next.js and other JavaScript frameworks aren't inherently bad for SEO.
But implementation choices matter.
Google documents JavaScript processing through stages including:
Crawling → Rendering → Indexing
That means an HTTP 200 response isn't the end of your SEO investigation.
Example
Raw response:
<div id="products"></div>
Rendered browser:
24 products, prices, descriptions and internal links.
Now imagine the product API fails during rendering.
Users under normal conditions might rarely encounter the failure.
But a crawler processing that response at the wrong moment may receive something materially different.
This is why important templates should be tested through both:
Raw HTML
and:
Rendered HTML
Check whether essential:
headings,
content,
links,
canonical tags,
structured data
remain available as intended.
Now add faceted navigation
An ecommerce site contains 20,000 products.
Filters generate:
?color=blue
?size=medium
?sort=price
?brand=x
and combinations.
Twenty thousand useful URLs can become hundreds of thousands of crawlable states.
Now ask:
Would you rather Googlebot spend resources discovering your newly launched product category or crawling:
?color=blue&size=m&sort=price&page=31
That's why crawl efficiency matters.
Investigate:
faceted navigation,
internal linking,
canonicals,
duplicate URLs,
pagination,
parameters,
redirects,
XML sitemaps,
orphan pages.
Server logs reveal reality
SEO crawlers tell you what they can crawl.
Server logs tell you what Googlebot actually requested.
That difference is invaluable.
4. How to Build Performance Monitoring That Leads to Action
A mature performance program combines three perspectives.
Synthetic testing
Use controlled testing to reproduce problems and compare builds.
Useful for:
debugging,
regression testing,
development.
CrUX
Use field data to understand aggregated real-world Core Web Vitals where data is available.
Useful for:
Google's field perspective,
trends,
device comparison.
RUM — Real User Monitoring
Capture performance from your actual visitors.
This allows questions such as:
Which product template has the worst LCP?
Which interaction creates the worst INP?
Are Indian mobile users experiencing slower pages than UK desktop visitors?
Now connect technical metrics to:
conversion rate
bounce/engagement
lead completion
revenue
Performance becomes a business conversation.
Instead of reporting:
"INP is 340ms."
report:
"Mobile product pages average poor responsiveness, with Add to Cart contributing disproportionately to slow interactions."
Your engineering team now knows where to investigate.
The performance hierarchy
Use:
Field data to identify
↓
RUM to isolate
↓
Lab tools to diagnose
↓
Engineering to fix
↓
Field data to validate
And remember:
The objective isn't getting 100/100 in PageSpeed.
It's making your website:
fast to load, fast to interact with, reliable to render and efficient to crawl.
If those improve, the green score is simply evidence—not the goal.
Written by
Udit
Webcooks Team
Keep reading
Related Posts

The Anatomy of Ai Slop: Why Volume-First Marketing is Failing

Why Your YouTube Videos Aren’t Getting Views — YouTube SEO Hacks That Actually Matter in 2026